

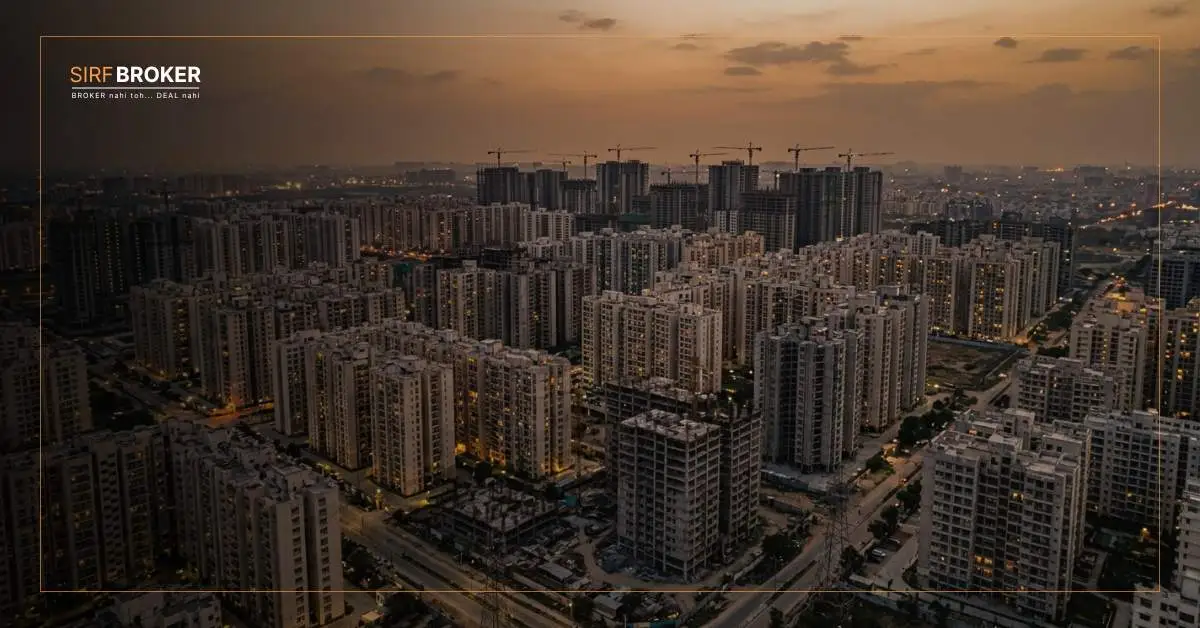
India’s residential market absorbed 1,12,458 homes across its top nine cities in Q2 2026 — a 19% year-on-year increase, according to data published today by PropEquity and reported by Business Standard and BusinessToday. That is not a recovery number. It is a structural performance number, set against a base quarter that was itself strong.
The supply side moved even more dramatically. New residential launches surged 43% year-on-year to 1,17,609 units in Q2 2026 — the largest quarterly supply addition in recent memory. Cities that have been supply-constrained for the past eighteen months — Mumbai, Navi Mumbai, Hyderabad — saw developer activity at scale.
For brokers, this is the most important data release of 2026 so far. It defines the market you are operating in for the next two to three quarters: where demand is strongest, where new inventory is arriving, and which city-level stories are worth telling clients right now.
| 1,12,458 homes sold in Q2 2026 — up 19% YoY. 1,17,609 units launched — up 43% YoY. For the first time in several quarters, supply is running ahead of sales. That changes the negotiation dynamic. Brokers who understand what that means by city are better positioned than those still using Q1 talking points. |
The City-by-City Breakdown — Where to Focus
| City | Q2 2026 Sales | Sales YoY | New Supply YoY |
|---|---|---|---|
| Bengaluru | 21,516 units | +47% | +71% |
| Hyderabad | 14,410 units | +22% | +75% |
| Chennai | 6,323 units | +18% | — |
| Mumbai | — | — | +111% |
| Navi Mumbai | — | — | +116% |
| Top 9 Cities (Total) | 1,12,458 units | +19% | +43% (1,17,609 units) |
Source: PropEquity, as reported by Business Standard and BusinessToday, June 26, 2026.
What the 43% Supply Surge Actually Means for Brokers
| WHAT THE SUPPLY SURGE MEANS BY CITY Mumbai / Navi Mumbai (+111% / +116%) → Developers who held back launches have re-entered at scale. Brokers should expect greater inventory availability and, in some micro-markets, increased developer willingness to negotiate on payment plans. Bengaluru (+71% supply, +47% sales) → Both sides moving fast. Supply and demand are roughly matched — market is healthy but not tilting toward buyer advantage. Price discipline from developers is likely to hold. Hyderabad (+75% supply, +22% sales) → Supply is growing faster than sales. In certain corridors this creates an emerging buyer’s window. Brokers should be identifying the oversupplied micro-markets and building that intelligence into client conversations now. |
The Segment Reality Beneath the Headline
| The ₹15–30 million segment (₹1.5–3 crore) grew 67% year-on-year in Q1 2026 per JLL India — the fastest-growing price bracket in the market. The incoming supply wave in Mumbai and Navi Mumbai in Q2 will likely concentrate in this band. Brokers whose client base sits in the ₹1.5–3 crore range will see the widest choice of new inventory in the next two quarters. |
For brokers navigating commission structures in a higher-volume market, the guide on protecting brokerage and commission in real estate transactions covers the documentation structures that become especially important when deal velocity increases.
How Brokers Should Use This Data
| Situation | How to Use Q2 Data |
|---|---|
| Buyer client hesitating | Share Q2 sales figure (+19%). Market is active — waiting is not a neutral position. |
| Buyer in Mumbai/Navi Mumbai | Supply jumped 111–116%. More inventory choices arriving. Prices unlikely to fall — developers responding to demand, not distress. |
| Buyer in Bengaluru | 47% sales growth. Hottest residential market in India. Inventory moves fast — buyers need to be pre-qualified and ready. |
| Developer / builder client | 1,17,609 launches largely absorbed. New projects at competitive pricing in the right corridors have a receptive market. |
For brokers building client communication through data, the article on how top brokers are building personal brands through market intelligence covers frameworks that convert data literacy into client trust.
Sirf Broker POV
India’s residential market just posted its strongest Q2 in years. That is the correct read of the data. But the more important question for brokers is not what happened in Q2 — it is what Q2’s supply surge tells you about Q3 and Q4.
When developers launch 1,17,609 units in a single quarter — a 43% jump — they are making a forward-looking bet on demand. In Mumbai, where supply more than doubled year-on-year, that is a significant bet. If GCC hiring slows, if interest rates reverse, or if the premium buyer softens, that supply could produce absorption pressure in specific corridors by year-end.
This is not a prediction that the market will soften. It is an observation that a supply surge of this magnitude creates micro-market differentiation that a city-level aggregate number will not reveal. The broker who knows that Hyderabad’s supply grew 75% while sales grew 22% — and can identify which specific corridors are absorbing well versus sitting — is the broker whose advice is worth paying for.
Read the data. Go one level deeper than the headline. That is where the broker value is.
Conclusion
Q2 2026 delivered the strongest residential quarter in recent memory — 19% sales growth, 43% supply surge, southern markets leading. Bengaluru is hot and fast, Mumbai and Navi Mumbai have a new supply window opening, Hyderabad’s supply outpacing sales creates a buyers’ opportunity in select corridors.
Before any residential transaction, ensure your clients understand the full cost — the guide on booking amount, token amount, and advance payment is one every broker should share before a site visit.
Frequently Asked Questions
1. How many homes were sold in India in Q2 2026?
1,12,458 homes were sold across India’s top nine cities in Q2 2026, up 19% year-on-year, according to PropEquity data reported by Business Standard and BusinessToday on June 26, 2026.
2. Which city had the highest residential sales growth in Q2 2026?
Bengaluru led with 47% YoY growth to 21,516 units. Hyderabad came second at 22% (14,410 units), Chennai third at 18% (6,323 units). Southern markets collectively outperformed.
3. Why did residential supply surge 43% in Q2 2026?
Developers responded to strong Q1 2026 demand by accelerating launches. Mumbai (+111%) and Navi Mumbai (+116%) saw the sharpest growth, as developers re-entered the market after holding back during the affordability debate.
4. What does the Q2 2026 supply surge mean for homebuyers?
More inventory choices are arriving, particularly in Mumbai, Navi Mumbai, and Hyderabad. In cities where supply outpaces sales, buyers have incrementally stronger negotiating positions. Prices are unlikely to fall — developers are responding to demand, not distress.
5. Is Bengaluru India’s strongest residential market in 2026?
By Q2 2026 growth metrics, yes — 47% YoY is the strongest growth among major cities, and 21,516 units absorbed signals very strong underlying demand driven by GCC expansion and tech hiring.
6. What price segment is driving India’s residential growth?
The premium segment (₹1 crore+) continues to drive the majority of launches and absorption. The ₹1.5–3 crore segment grew 67% YoY in Q1 2026 per JLL India — the fastest-growing price bracket in the market.
7. How should brokers use Q2 2026 housing data in client conversations?
Use +19% sales data to address buyer hesitation. Use city supply data to set inventory expectations. In Bengaluru, speed matters. In Hyderabad and Mumbai, greater inventory choice is opening a window for buyers who have been waiting.
Sources
- PropEquity / Business Standard — June 26, 2026 — Q2 2026 sales 1,12,458 units (+19% YoY), launches 1,17,609 (+43% YoY). business-standard.com
- BusinessToday — June 26, 2026 — Bengaluru +47%, Mumbai +111%, Navi Mumbai +116%. businesstoday.in
- JLL India — Residential Dynamics Q1 2026 — ₹15–30M segment +67% YoY. jll.co.in
- Knight Frank India — Q1 2026 — Premium share 64%, prices +8–20% YoY. knightfrank.co.in
| Disclaimer: Published by Sirf Broker for educational purposes only. Not investment or transaction advice. All data from publicly available reports cited above. |