

Between 2023 and 2025, the average price of a home sold in India’s primary residential market rose from ₹1.13 crore to ₹1.47 crore — a 30 percent increase in under two years. In the same period, total unit volumes fell slightly, from 5.12 lakh units in 2024 to 4.98 lakh units in 2025. Fewer homes were sold. More money was spent. And the homes themselves got larger.
That combination — rising values, falling volumes, bigger apartments — is not a random market fluctuation. It is the product of deliberate shifts in who is buying, what they are buying, and what developers are choosing to build. Understanding it matters whether you are a buyer wondering if you can afford to enter the market, a broker advising clients on timing, or a developer deciding what to launch next.
The Numbers: What Changed and Where
The average home ticket size across India’s primary residential market rose from ₹1.13 crore in 2023 to ₹1.47 crore in 2025, according to market data. This headline figure conceals significant city-level variation:
| City | Average Ticket Size (CY25) | Note |
|---|---|---|
| Gurugram (NCR) | ₹5.21 crore | Highest in India |
| Delhi NCR overall | ₹3.64 crore | Luxury concentration |
| Mumbai | ₹2.31 crore | Land-constrained premium |
| Hyderabad | ₹1.96 crore | Tech sector demand |
| Bengaluru | ₹1.71 crore | IT-driven price growth |
| India average | ₹1.47 crore | Up from ₹1.13 crore in 2023 |
In the country’s Tier 1 cities combined, primary housing sales in 2025 reached approximately ₹7.3 lakh crore — up 8 percent from the previous year. But total unit sales fell approximately 3 percent, from around 5.12 lakh units to 4.98 lakh units. Value grew. Volume fell. That is the clearest summary of the current market dynamic.
Driver 1 — Apartments Are Simply Bigger
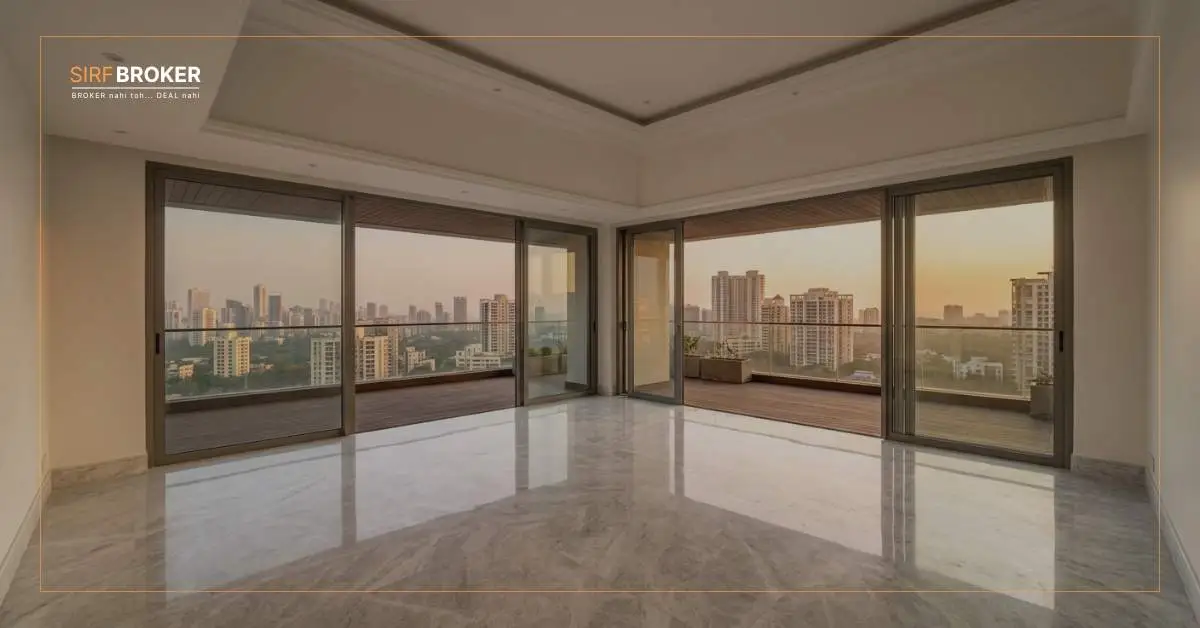
The average apartment size across India’s top seven cities grew from 1,420 square feet in 2023 to approximately 1,676 square feet in 2025 — an 18 percent increase in two years, according to residential market data. When the physical size of what is being sold increases by 18 percent, the ticket size rises even without any per-square-foot price increase.
The expansion in apartment size reflects a post-pandemic recalibration of what buyers want. Remote and hybrid work has sustained demand for additional rooms, home offices, and larger living areas. Developers have responded by configuring larger units — 3BHKs where 2BHKs previously dominated, 4BHKs entering what used to be a 3BHK-only segment. A buyer who purchased a 1,400 sq ft 3BHK in 2022 is now looking at 1,700 sq ft as the minimum for a comparable product in 2026.
Driver 2 — Developers Have Repositioned Upmarket
The developer response to sustained premium demand has been structural, not just tactical. Nationally, the premium segment (homes above ₹10 million) now accounts for 71 percent of all residential sales by value, up from 59 percent in Q1 2025, according to JLL India’s Q1 2026 Residential Dynamics Report. Launches in the ₹15–30 million bracket surged 134 percent year-on-year.
Developers have followed the demand curve — and in some cases, created it. Land in prime micro-markets is too expensive to justify anything below ₹2 crore per unit economically. Developers who once built mass-market products in those locations have repositioned to premium and luxury, where margins are higher and buyer profiles more resilient to interest rate movements. The affordable housing segment, by contrast, has seen both demand compression and developer retreat.
For buyers entering the market, understanding what circle rates are and how they affect transaction costs is now more important than ever — especially when ticket sizes are crossing thresholds where stamp duty represents a more significant absolute cost.
Driver 3 — The Buyer Profile Has Changed
The pool of active residential buyers in 2026 skews toward dual-income urban households, NRI investors, and upgrade buyers rather than first-time purchasers. These buyers are less sensitive to per-square-foot price increases and more focused on product quality, brand credibility, and location premium. They are also more informed than previous cohorts — capable of comparing projects, evaluating developer track records, and negotiating from a position of knowledge.
The income profile required to sustain an average ₹1.47 crore home purchase (assuming standard 80% mortgage at prevailing rates) has moved meaningfully. This creates a structural floor for the premium market but a structural ceiling for first-time buyers, who increasingly cannot access primary market product in Tier 1 cities at all. The gap between the market’s average ticket and what a median urban household can finance is wider now than at any point in the last decade.
What This Means for Brokers and Buyers in H2 2026
For brokers, the rising ticket size has a direct commission implication — higher transaction values mean higher absolute earnings per deal even if commission rates remain flat. The critical skill shift is in qualifying buyers accurately at the outset. A buyer who needs a ₹60 lakh home cannot be served by a broker who only has access to ₹1.5 crore product. The market’s bifurcation makes buyer qualification more important, not less.
For buyers, the ₹1.47 crore average is a market-wide signal — not a ceiling. In cities like Gurugram and NCR, where averages are ₹3.64 crore and above, the entry point for comparable product has moved significantly. Buyers who have been waiting for prices to correct should be aware that the structural drivers — larger apartments, developer repositioning, premium buyer profiles — are not cyclical. They do not correct when sentiment improves. They correct when supply fundamentally changes, which is a longer cycle.
| SIRF BROKER POV The ₹1.47 crore national average is not the story. The story is that the average is being pulled upward by a market concentration that does not represent most Indian households. Gurugram at ₹5.21 crore average and Bengaluru at ₹1.71 crore are both above the headline — but they also represent cities where the buyer profile is genuinely different from a mid-size city or peripheral location. What concerns Sirf Broker is the speed of the shift. A 30 percent rise in average ticket size in two years, accompanied by a 3 percent fall in unit volumes, is a market concentrating its activity in a narrower segment of the population. The aggregate numbers look healthy. But health in any market depends on distribution, not just totals. When 71 percent of sales are in the premium segment and the affordable segment is contracting, the question is not “is the market growing?” but “who is the market growing for?” Brokers who anchor their business to the ₹1.47 crore average without understanding that it misrepresents the city and micro-market they actually operate in will miscalibrate their buyer conversations. Know your micro-market’s average. The national number is a headline, not a price guide. |
Conclusion
India’s average home ticket size rising from ₹1.13 crore to ₹1.47 crore in two years is the product of three simultaneous forces: apartments are physically larger, developers have repositioned toward premium product, and the buyer pool has skewed toward more affluent households. None of these trends are reversing in H2 2026. For buyers, the implication is that waiting is not a strategy. For brokers, it is an opportunity — but only if they understand their specific market rather than the national headline.
For those exploring the market as first-time buyers or investors, understanding the difference between booking amounts, advance payments, and token amounts is essential groundwork before committing to any transaction at this price level.
Frequently Asked Questions
Q: What is the average home price in India in 2026?
A: The average home ticket size in India’s primary residential market rose to approximately ₹1.47 crore in 2025 (CY25), up from ₹1.13 crore in 2023 — a 30 percent increase in under two years, according to residential market data.
Q: Which city has the highest average home price in India in 2026?
A: Gurugram (part of Delhi NCR) recorded the highest average ticket size in CY25 at ₹5.21 crore, followed by NCR overall at ₹3.64 crore, Mumbai at ₹2.31 crore, Hyderabad at ₹1.96 crore, and Bengaluru at ₹1.71 crore.
Q: Why have home prices in India risen so sharply?
A: Three primary drivers: apartments have grown 18 percent in average size (from 1,420 sq ft to 1,676 sq ft); developers have repositioned toward premium product where margins are higher; and the active buyer pool has shifted toward dual-income households, NRI investors, and upgrade buyers who are less price-sensitive.
Q: Did total home sales volumes rise or fall in 2025?
A: Total unit volumes fell approximately 3 percent in 2025, from around 5.12 lakh units to 4.98 lakh units — even as total residential sales value rose 8 percent to approximately ₹7.3 lakh crore across Tier 1 cities. Fewer homes were sold, but at higher prices.
Q: What share of Indian home sales is now in the premium segment?
A: The premium segment (homes above ₹10 million, approximately ₹1 crore) accounted for 71 percent of all residential sales by value in Q1 2026, up from 59 percent in Q1 2025, according to JLL India’s Q1 2026 Residential Dynamics Report.
Q: Is the rising average ticket size a sign of a healthy market or a bubble?
A: The rise is primarily structural — driven by larger apartments, premium repositioning, and a wealthier buyer profile — rather than speculative. However, the concurrent 24 percent fall in affordable housing sales and narrowing buyer base are distributional concerns that suggest the market’s health is concentrated in a specific segment, not universal.
Q: What does the average ticket size rise mean for home buyers who cannot afford ₹1.47 crore?
A: The primary market in Tier 1 cities is increasingly inaccessible to first-time buyers below a certain income threshold. Options include exploring Tier 2 cities where affordability remains stronger, looking at resale markets, or reviewing PMAY-U 2.0 subsidy eligibility for qualifying income groups.
- JLL India — Q1 2026 Residential Dynamics Report
- Market residential price data — CY23 to CY25
- Housing market analysis — crematrix.com research
Disclaimer: This article is for informational and educational purposes only. Property prices vary significantly by city, micro-market, developer, and configuration. Sirf Broker is a real estate education and media platform and does not provide investment or financial advice. Consult a qualified professional before making a property purchase.