

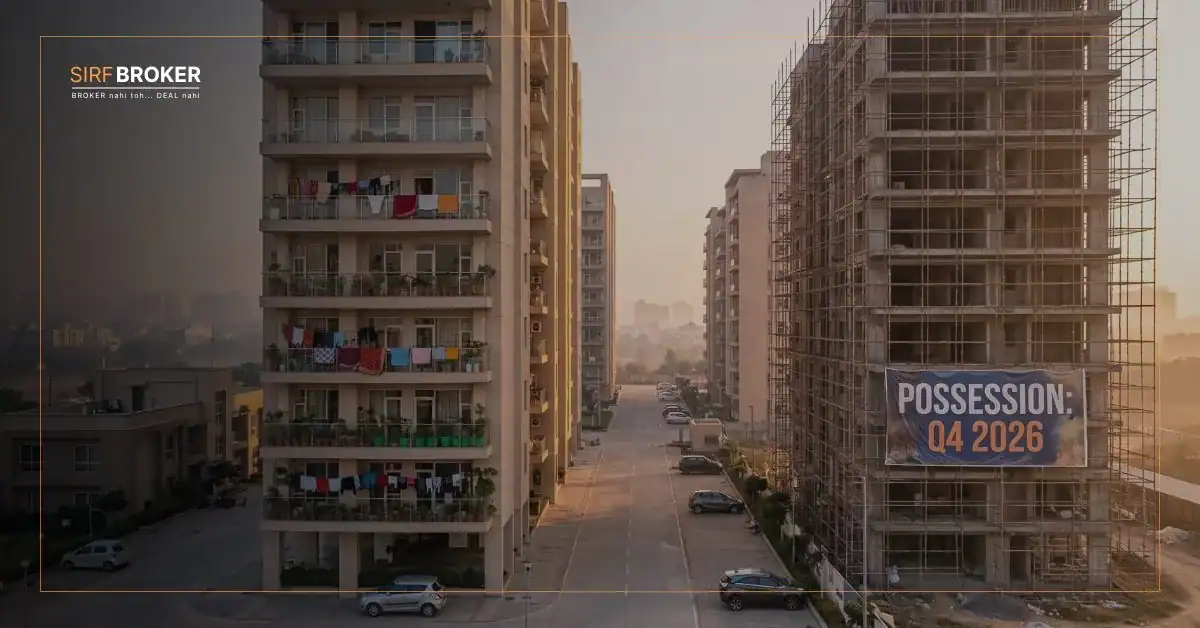
The Reserve Bank of India’s All India House Price Index recorded a 4.2% year-on-year rise in the January to March 2026 quarter — up from 3.8% in the same quarter the previous year. Within hours, headlines were advising buyers to act before it gets worse.
That advice is not necessarily wrong. It is almost certainly incomplete. And making a property decision — the largest financial commitment most households will ever make — on an incomplete reading of a national index is the kind of mistake that shows up in your bank account for twenty years.
This article is for anyone weighing a purchase in 2026: a first-time buyer, an upgrader, an NRI deciding whether to invest, or someone whose broker is telling them the market will only go higher. The national price index tells you one thing. The city-level data, the supply pipeline, the developer track record, and the interest rate environment tell you something more useful. Here is how to read all of it together.
| “Buy now or wait” is the wrong question. The right question is: is this specific project, from this specific developer, in this specific micro-location, a better deal today than in 12 months? That question cannot be answered with a national average. It requires city-level data, a verified RERA status, the developer’s delivery track record, and a clear-eyed look at what infrastructure is actually confirmed near the project. |
What the RBI House Price Index Actually Measures — and What It Doesn’t
The RBI’s All India House Price Index is compiled from residential property registration data across ten major Indian cities. It tracks the average price change in residential transactions that go through stamp duty registration. That means it captures completed deals, not listing prices. It is a lagging indicator — it tells you what buyers paid in the past quarter, not what is happening in the market today.
| What the RBI Index Tells You | What It Doesn’t Tell You |
|---|---|
| National average price change: +4.2% YoY in Q1 2026 | Which cities drove the average — and which flatlined |
| Based on actual registered transactions — not listing prices | Which price segments moved — affordable vs premium vs luxury |
| A confirmed direction of travel for the market overall | The supply pipeline — how much new inventory is entering the market |
| A benchmark to compare with previous quarters | Developer quality, RERA compliance, or project-level risk |
| A lagging signal — reflects Q1 2026 registered transactions | What prices are doing right now, or will do in the next 12 months |
Before any purchase, understanding how the registered transaction value — which the RBI index captures — interacts with circle rate is essential. Stamp duty is calculated on whichever is higher: the circle rate or the actual deal value. The guide to what circle rate is and why it matters in property deals explains the mechanics and how it affects your real purchase cost.
The City-Level Picture Is Not Uniform
The national 4.2% average is shaped by dramatically different city-level performances. Using it to make a purchase decision in any specific city is like navigating a road in Bengaluru using a map of India.
| Market Type | Price Trend | What Is Driving It | Buyer Implication |
|---|---|---|---|
| NCR, Bengaluru, Hyderabad, Chennai | Double-digit in quality supply | Limited new quality supply; strong employment demand; confirmed infrastructure | Waiting carries a real price cost in well-located projects |
| Tier 2 metros (Pune, Ahmedabad) | Moderate, steady appreciation | GCC and corporate expansion; improving connectivity; relative affordability | Good entry window but project selection is critical |
| High unsold inventory markets | Flat to marginal movement | Large overhang of older or stalled inventory; buyer leverage exists | Less urgency — negotiate on price and terms |
| Premium / luxury segment nationally | Strong — leading the market | Wealthier buyers less rate-sensitive; strong NRI demand | Rising fastest; less negotiation room |
| Affordable / mid-segment | Moderate — volume under pressure | Rising input costs; EMI sensitivity; some demand deferred | Rate cuts improve affordability — timing matters more here |
According to Knight Frank India’s India Real Estate Outlook, Delhi NCR, Bengaluru, Hyderabad, and Chennai recorded double-digit price appreciation in quality supply segments in recent periods. Markets with larger supplies of older or stalled inventory saw significantly flatter movement. The national 4.2% is the average of those two realities — not a description of either.
What Happened to Sales Volume — And Why That Number Matters Too
The price increase is happening against a backdrop where sales volume fell in 2025. According to ANAROCK Research, housing sales across India’s top seven cities dropped approximately 14% — from roughly 4.59 lakh units in 2024 to 3.95 lakh units. Yet the total value of those sales rose 6% year on year, crossing ₹6 lakh crore.
| Fewer units, higher total value. India sold 14% fewer homes in 2025 than in 2024 — but the total market value grew 6%, to over ₹6 lakh crore. This is not a contradiction. It is a structural shift: activity concentrated in premium and luxury segments, where unit prices are high and buyers are less rate-sensitive. The affordable and mid-segment volume market came under pressure from rising input costs and buyer caution. The buyer who reads this as “the market slowed” and the buyer who reads it as “premium demand accelerated” are both right — and need very different advice. (Source: ANAROCK Research) |
The Interest Rate Trap — What the RBI’s Stance Actually Means for Your Decision
The RBI’s monetary policy stance in 2026 is leaning toward supporting demand. Rate cuts — or the expectation of further cuts — have been broadly supportive of housing demand and developer project execution timelines, according to analysis reported by Business Standard citing real estate industry stakeholders.
For a buyer holding a home loan decision in mid-2026, the rate environment is more favourable than it was in 2023 or 2024. But most buyers misread what a rate cut actually does to their purchase economics.
| The interest rate trap: A 50 basis point rate cut on a ₹75 lakh home loan reduces your EMI by approximately ₹2,500–3,000 per month. But if property prices in your target segment appreciate by 5–7% over the 6–12 months you waited for that cut, the purchase price has risen by ₹3.75–5.25 lakh on the same property. The EMI saving does not recover that. In high-demand micro-markets, waiting for rates to fall can cost more than the rate cut saves. In markets with high unsold inventory, the calculus is different — and waiting may genuinely be the right call. |
What Defines a Good Buy in This Market
| THE FOUR-QUESTION BUYER FRAMEWORK Question 1 → Is this project RERA-registered, with current quarterly progress filings on the state portal? If not, do not proceed. Question 2 → Has this developer delivered past projects on time and to advertised specification? If unknown, the discount you’re seeing is payment for that risk. Question 3 → Is there confirmed, funded infrastructure — metro, highway, commercial development — near this location, with a visible construction timeline? Question 4 → What is the total purchase cost — headline price plus stamp duty, registration, GST if under construction, and maintenance deposit? Is that total within your real capacity? A project that answers all four questions satisfactorily is a good buy in 2026 — regardless of where the national average is going. |
The guide to the difference between booking amount, advance payment, and token amount covers the transaction mechanics every buyer needs to understand before committing any funds. And for buyers considering government subsidy schemes, the breakdown of what PMAY-Urban 2.0 actually guarantees — and what it doesn’t is essential reading before your broker makes any promises about subsidies.
The Buyer’s Due Diligence Checklist
| Check | Where to Verify | Red Flag |
|---|---|---|
| RERA registration | State RERA portal — search by project name | Project not listed, or listed with lapsed / under-objection status |
| RERA quarterly filings | State RERA portal — project page, quarterly updates tab | Filings missing for 2+ consecutive quarters |
| Developer delivery history | Previous buyer reviews; site visits to delivered projects; broker references | Multiple delayed projects or buyer complaints on RERA portal |
| Infrastructure around the location | NHAI, state PWD, metro authority websites; Google Maps construction view | No confirmed funded project — only “proposed” or “planned” status |
| Total cost of purchase | Developer cost sheet; state stamp duty calculator; GST applicability check | Hidden charges; developer unable to provide itemised breakup |
| Carpet area vs super built-up | RERA registration document — carpet area is defined under the Act | Developer quoting price on super built-up area without disclosing loading factor |
| Bank loan approval for project | Confirm project is on the approved list of at least 2 major banks | No bank has approved the project — signals title or compliance issues |
Red Flags That Should Pause — or Stop — a Purchase Decision
- The project is not registered under RERA, or the broker cannot confirm its registration number
- RERA quarterly filings are missing or show construction significantly behind timeline
- The developer has more than one project on state RERA portals with buyer complaints or delay orders
- The developer is offering an unusually large discount “only this week” or “only for cash buyers”
- No major bank has approved a home loan against the project
- The total cost breakup changes between the verbal discussion and the written cost sheet
- Infrastructure cited as a price catalyst is “proposed” with no confirmed funding or timeline
- The area has significant unsold inventory from other developers at lower prices
- The possession date is more than 36 months away with no construction currently visible on site
Sirf Broker POV
The “buy now or wait” question is the single most common thing buyers ask brokers in India, and it almost always generates the wrong answer — because the question itself is the wrong frame.
“Buy now or wait” treats property as a monolithic market moving in a single direction. It doesn’t. The RBI’s 4.2% national average includes cities where prices are up 12% in quality supply and markets where older inventory has flatlined. A buyer in Hyderabad’s Gachibowli corridor is in a fundamentally different situation from a buyer looking at a resale flat in a Tier-3 city. The national number is almost useless to either of them.
What buyers should be asking instead: is this specific project, from this specific developer, in this specific micro-location, at this price point, a better deal today than it will be in 12 months? That question requires knowing the local supply pipeline, the developer’s delivery track record, the confirmed infrastructure timeline, and the current home loan rate environment.
The data available in 2026 suggests that in quality, RERA-registered projects in high-absorption metro micro-markets with confirmed infrastructure investment, waiting carries a real and measurable price risk. In markets with abundant unsold inventory and uncertain infrastructure pipelines, there is less urgency — and more negotiating room. The national price index does not help you navigate that distinction. Granular, project-level research does.
The mistake we see buyers make most often is not acting too early or too late. It is making a market-level decision for a project-level investment.
Conclusion
India’s housing prices are rising — the RBI data confirms the trend is consistent and slightly accelerating into 2026. But a buyer who acts on the national average without interrogating the city-level, segment-level, and project-level picture is working with about 20% of the information they need to make a good decision.
Use the Four-Question Framework above. Verify RERA status directly on the state portal. Run the due diligence checklist before committing any booking amount. The difference between a good property decision and a poor one in 2026 is not timing the market — it is choosing the right project.
Frequently Asked Questions
1. How much have house prices in India risen in 2026?
According to the Reserve Bank of India’s All India House Price Index, residential property prices rose 4.2% year-on-year in the January to March 2026 quarter, up from 3.8% in the same quarter the previous year. This is a national average across ten cities — city-level performance varies significantly, with NCR, Bengaluru, and Hyderabad recording double-digit appreciation in quality supply segments, while markets with high unsold inventory saw much flatter movement.
2. Is it a good time to buy property in India in 2026?
It depends on the city, micro-location, segment, and project. In high-demand metro markets with limited quality supply and confirmed infrastructure investment, waiting has a real price cost. In markets with high unsold inventory and weaker infrastructure pipelines, there is less urgency. RERA registration status and developer track record matter more to the quality of the decision than timing alone.
3. Why did housing sales volume fall in 2025 if prices were rising?
According to ANAROCK Research, housing sales across India’s top seven cities dropped approximately 14% in 2025 — from 4.59 lakh units to 3.95 lakh units — while total sales value rose 6% to over ₹6 lakh crore. This reflects a structural shift toward premium and luxury segments, where wealthier buyers absorbed market value, while affordable and mid-segment volumes came under pressure from rising input costs and buyer caution.
4. What is the RBI House Price Index and how is it calculated?
The RBI All India House Price Index is compiled from residential property registration data across ten major Indian cities. It tracks average price changes in actual completed transactions — not listing prices. Because it captures registered deals, it is a lagging indicator: it reflects what buyers paid in the previous quarter, not what is being transacted today.
5. How do RBI interest rate cuts affect property prices in India?
Rate cuts lower home loan EMIs, expanding the buyer pool — particularly in the mid-segment where affordability is rate-sensitive. However, price savings from waiting for a rate cut can be offset by appreciation in high-demand markets. A 50 basis point cut reduces a ₹75 lakh loan EMI by roughly ₹2,500–3,000 per month, but price growth of 5–7% on the same property over the waiting period could add ₹3.75–5.25 lakh to the purchase cost — more than the EMI saving over the same period.
6. What should I check before buying a residential property in India in 2026?
Four checks matter most: (1) Verify RERA registration and current quarterly progress filings on your state RERA portal. (2) Research the developer’s delivery history on past projects. (3) Confirm infrastructure investment near the micro-location is funded with a visible construction timeline — not just “proposed.” (4) Get a complete itemised cost sheet covering stamp duty, registration charges, GST if under construction, and any maintenance deposits required at possession.
7. What is the difference between the national house price average and city-level performance?
The national 4.2% average smooths out dramatically different city and segment-level performances. In 2025–26, cities like NCR, Bengaluru, Hyderabad, and Chennai recorded double-digit appreciation in quality supply, while markets with large unsold inventory saw significantly flatter movement. A buyer using the national figure to make a decision in any specific city is working with data that may not represent their market at all.
Sources and References
- Reserve Bank of India — All India House Price Index (Q1 FY2025-26) — 4.2% YoY increase in the January–March 2026 quarter; 3.8% in the same quarter the prior year. rbi.org.in
- ANAROCK Research — India Residential Market 2025 Annual Data — Sales volume decline of 14% in 2025 across top 7 cities (3.95 lakh units vs 4.59 lakh units in 2024); total sales value rise of 6% to ₹6+ lakh crore. anarock.com/research
- Knight Frank India — India Real Estate Outlook — Double-digit price appreciation in NCR, Bengaluru, Hyderabad, and Chennai in quality supply segments. knightfrank.co.in
- Business Standard (June 2026) — RBI rate stance and impact on housing demand and developer execution timelines.
- State RERA Portals — MahaRERA (maharera.mahaonline.gov.in), UP RERA (up-rera.gov.in), HRERA (hrera.org.in) — project registration, quarterly filings, and compliance verification.
Disclaimer
| This article is published by Sirf Broker for educational and informational purposes only. It is not investment, financial, or legal advice. Property market performance varies significantly by city, micro-location, project, developer, and market conditions. National or city-level price trends do not guarantee any specific price appreciation, investment return, or market outcome on any individual property. All data points are referenced from publicly available sources cited above and reflect reporting available at the time of writing. Buyers should conduct independent due diligence, verify all claims directly on state RERA portals, and consult qualified legal and financial professionals before making any property purchase decision. |